

Upgrade: pgCenter 0.9.0 is out!
Since the last pgCenter release I’ve been working on some new improvements and now it’s time to introduce you to pgCenter 0.9.0. Here are a few key…
Since the last pgCenter release I’ve been working on some new improvements and now it’s time to introduce you to pgCenter 0.9.0. Here are a few key…
Прошло 5 месяцев с момента выхода разработанной нашим DBA, Алексеем Лесовским, динамической реализации диаграммы Postgres Observability – pgstats.dev. За это время мы получили огромное количество комментариев, предложений,…
A few years ago I was preparing my talk for a conference and couldn’t find a good illustration of Postgres internals. This is how Postgres Observability…
Golden Signals and RED methods are the monitoring templates which define key metrics required for monitoring services. Earlier these methods were known only to monitoring administrators and…
New shiny Postgres 13 has been released and now it’s the time for making some updates to “Postgres Observability” diagram. New release includes many improvements related to…
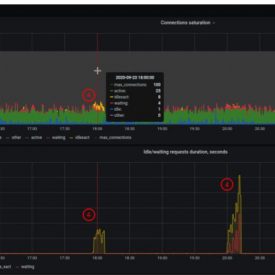
As you might know, in the last pgCenter release the new tool has been added – wait events profiler. In this post, I’d like to explore this…
Data Egret® GmbH
Represented by Ilya Kosmodemiansky, Shareholder and Managing Director
Address
Herrenstr.1 A 2
66583 Spiesen-Elversberg,
Germany
Contact
+49 6821 919 3297
Commercial Register
HRB: 106974
District Court Saarbrücken
Tax ID: 040/107/66104
VAT ID: DE338182079
Copyright and Image Rights
© Data Egret GmbH
Any use of this copyright-protected publication or any articles and images contained herein, in particular by reproduction or distribution, requires prior written consent from the company, unless otherwise permitted by copyright law. Storage or processing in data systems is not permitted without the company’s consent.
| Package | Price* | |
|---|---|---|
| PostgreSQL configuration analysis | from 500 € | |
| Hardware and OS configuration analysis | from 600 € | |
| Slow SQL queries analysis | from 500 € | |
| Comprehensive performance Health Check* | from 3500 € | |
| * For single PostgreSQL installation (1 master + 1 replica)
| ||
When using websites dataegret.com and dataegret.de, submitting contact forms or registering and watching recorded webinars, your personal data may be processed. On this page we inform you about these processing activities in accordance with the legal provisions of the General Data Protection Regulation (GDPR).
The responsible body for processing (“data controller”) is:
Data Egret GmbH
Herrenstr. 1 A 2
66583 Spiesen-Elversberg
Germany
Represented by: Ilya Kosmodemiansky, Founder and CEO
Phone: +49 6821 919 3297
Email: [email protected]
Website: https://www.dataegret.com
If you have any questions about this data protection information or data protection at Data Egret® GmbH in general, please contact us at [email protected] before submitting any forms or registering for webinars through our website.
We periodically update our Privacy Policy to comply with the most recent regulations and to encompass our marketing activities. We therefore encourage you to review this Privacy Policy periodically.
The current Policy was last updated on 5 June 2026.
ZenLeads Inc. d/b/a Apollo.io – a web-based sales CRM – monitors website activity, including page visits, to gather data for its sales and marketing platform. This includes identifying companies that visit specific pages.
When you register for one of our Courses, we collect and process your name and contact information for the following purposes:
To ensure optimal call quality during the Course, we also process certain technical data from your device or internet connection. This processing is necessary to fulfil our agreement with you (Art. 6(1)(b) GDPR).
We use the Zoom Video Communications, Inc. (“Zoom”) platform to conduct our Courses. Therefore, the information you provide during registration will be stored on Zoom servers. You can learn more about Zoom’s GDPR compliance here: Zoom GDPR Compliance
During the Course, you may choose to ask questions via Zoom’s chat function or through audio/video if your microphone or camera is enabled. You can also ask questions anonymously using Zoom’s Q&A feature.
Privacy and Data Handling
When you register to participate in our webinars, we process your name and contact information, which we use for:
While participating in the webinar, technical information from your end device or your Internet connection will be processed to ensure optimal call quality. The processing is necessary for the fulfilment of the agreement to participate in the webinar (Art. 6 (1) b GDPR).
We use Zoom Video Communications, Inc. (“Zoom”) platform for conducting our Webinars, which means that information you provide during registration to our Webinars will be stored on Zoom servers. You can read about Zoom GDPR compliance here.
Recording of webinars
In some of the webinars it is possible to ask questions. This can be done either with the chat function included in the Zoom application or as audio/video if the microphone or camera is activated. Since most of our webinars are recorded, your data will also be part of the recording in these cases. The processing takes place with your consent in accordance with Art. 6 (1) a GDPR and the transmission to countries outside the European Union on the basis of Art. 49 (1) a GDPR. Consent is voluntary, alternatively you can send your question by email [email protected] and your name will not be mentioned in the webinar.