

Linux Performance Observability Tools. Top.
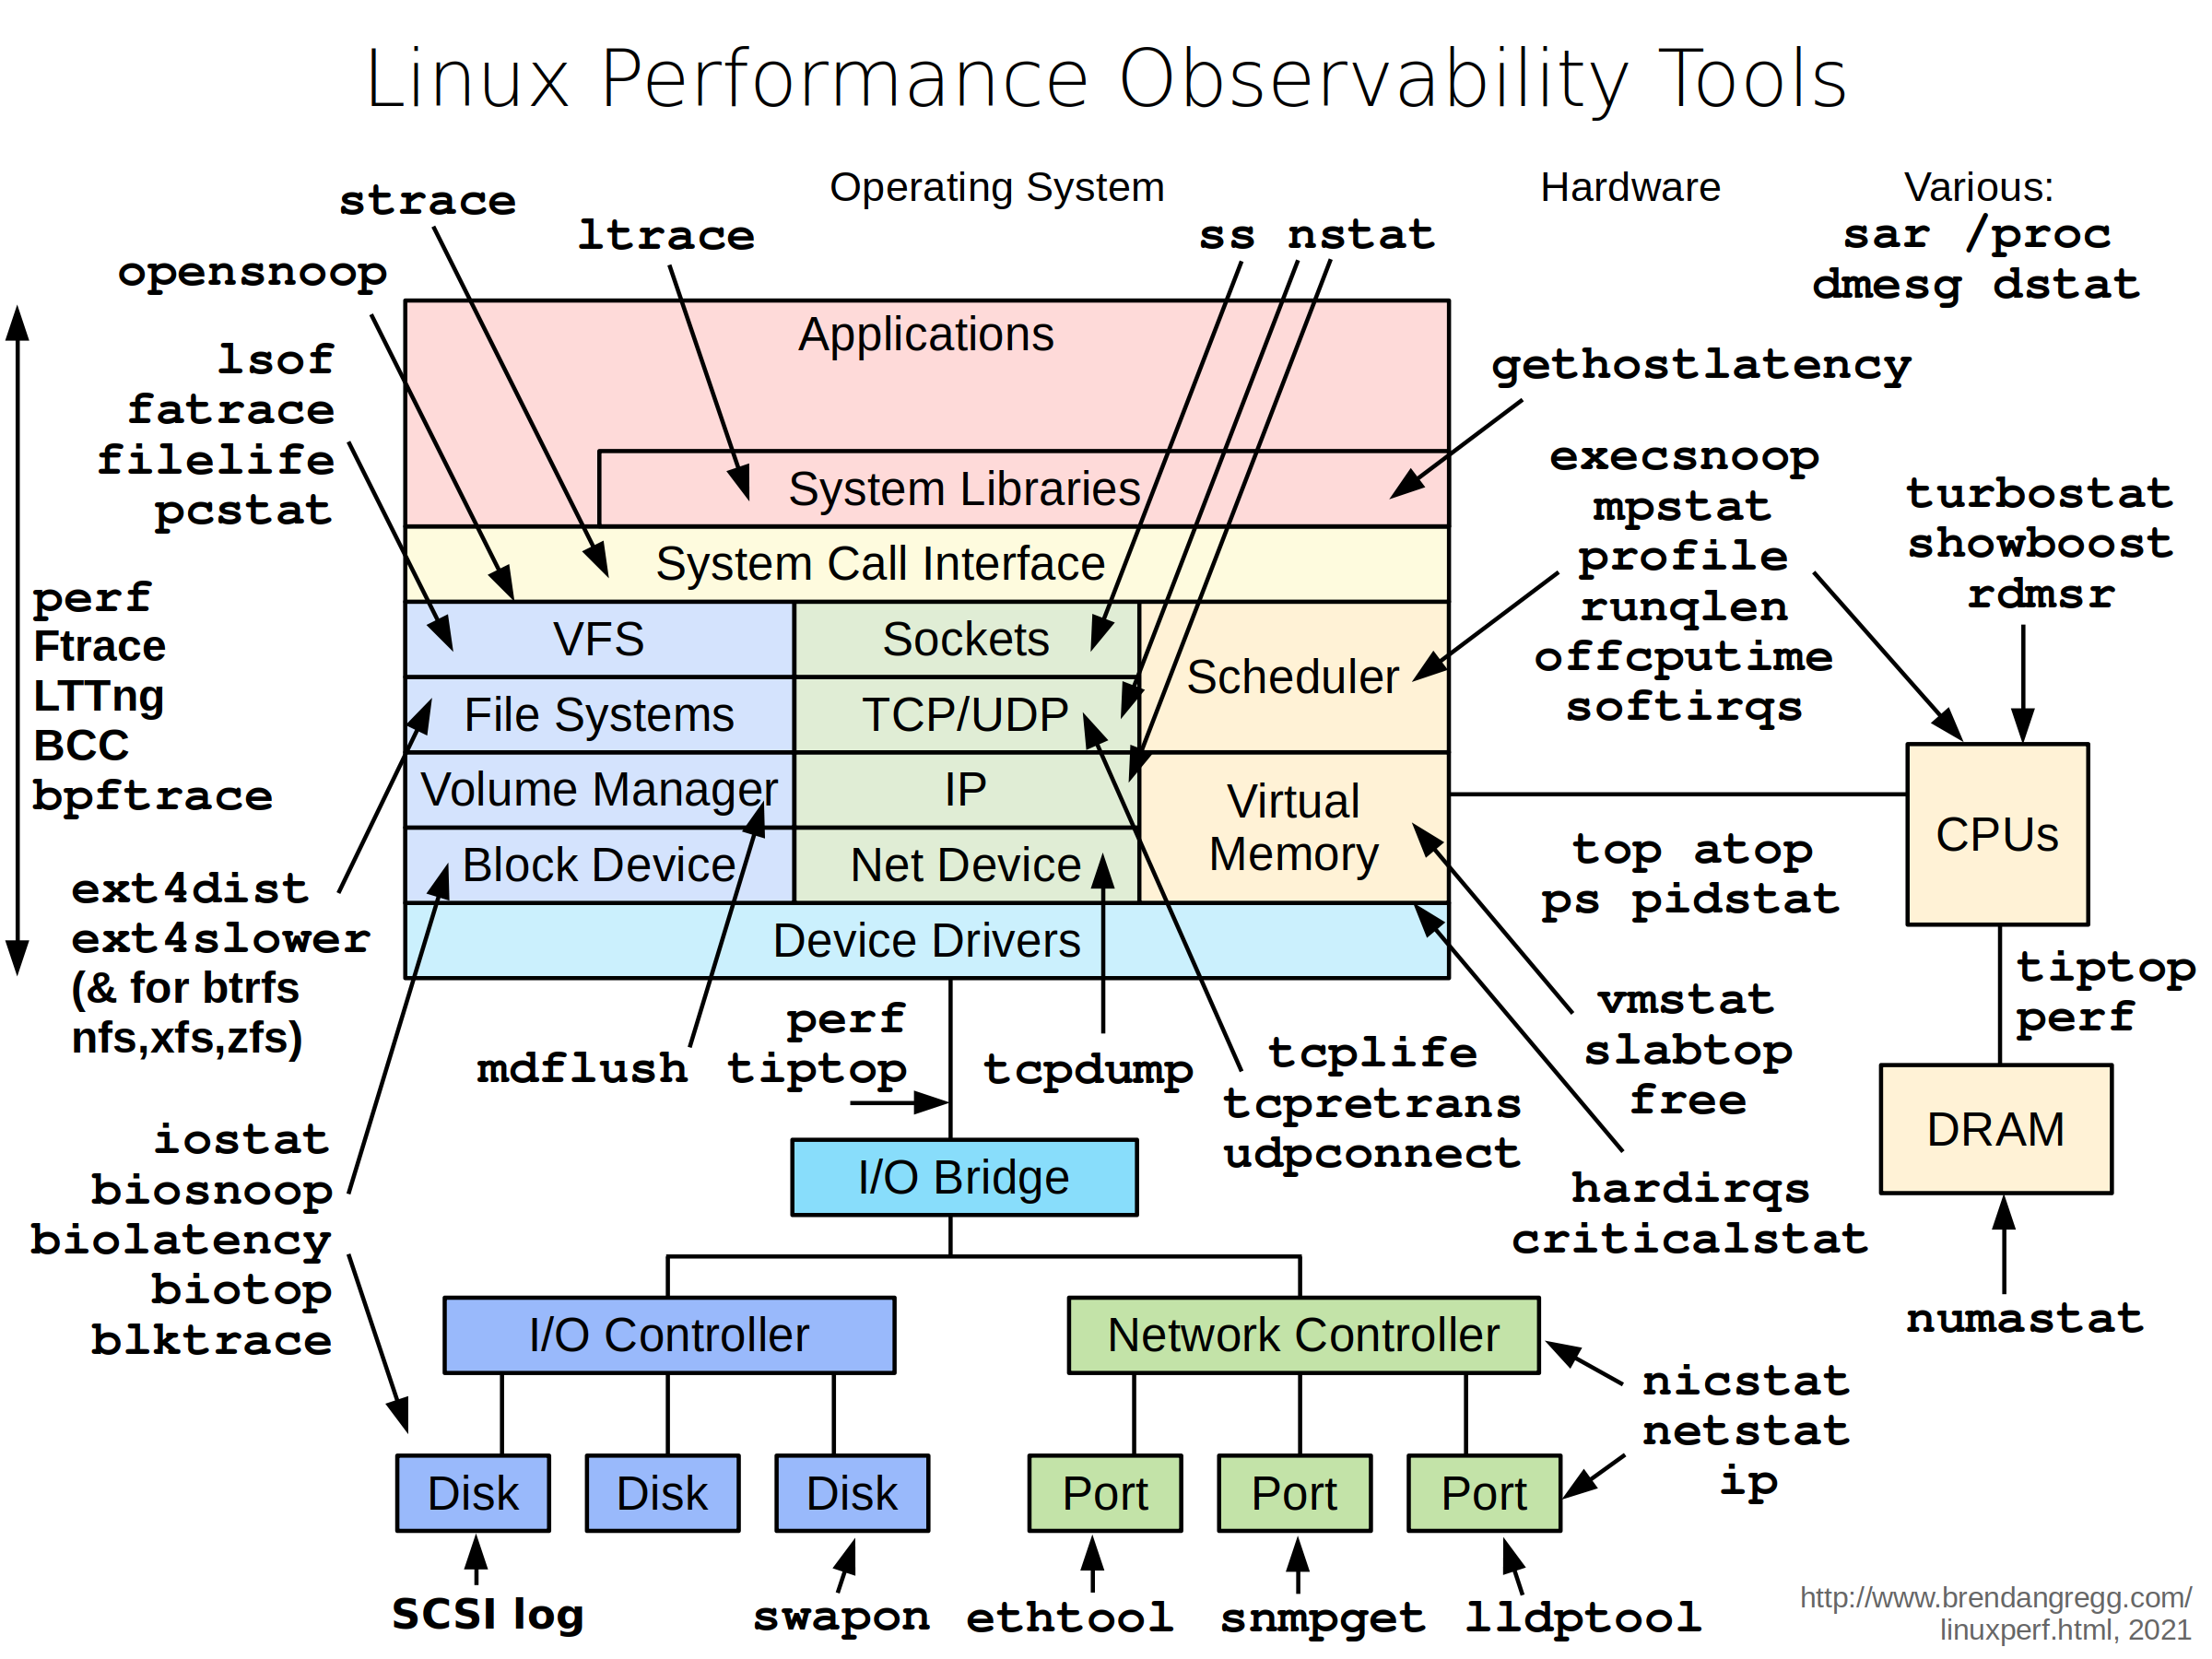
Picture is a courtesy of Brendan Gregg Blog.
Given above are Linux Performance Observability Tools. At a first glance, the picture may seem confusing, so let’s see what it is all about. This picture, in a very simplified form, represents the structure of the Linux operating system, as well as each component of the structure of the signed instrument that allows you to monitor the operation of this component. These tools are very useful in the case when the server is “slow” and you need to identify which component causes the it. System and network administrator or engineer should be able to use most of these tools. As you can see, that’s a lot of instruments, some of which may be familiar to you and some not. Some of these tools are fairly simple to use, and some, on the contrary require high qualifications and additional knowledge. In the following series of posts I will try to consider the most popular and interesting tools, and touch upon how to read the information they provide and how to use it in the future.
The first tool to consider is the “top” utility. This utility displays the dynamics of the current state of the operating system and allows the administrator to assess the current state of the system in general. More particularly, top displays summary information about the system, including a list of processes in the system and basic information about these processes. This information includes data about the consumption of system resources, such as a CPU and memory. Undoubted advantage of top is that it is installed in almost any distribution. To run it, just type in the console “top” and press Enter. So let’s see what information is provided by the top utility.

The first thing worth noting is that the output is divided into two parts: the upper part is the summary information about the system, the lower part a list of processes and detailed information about the processes. We start from the top.

Let’s start line by line from top to bottom. In the very first line we see:
time (14:13:50) and uptime (up 167 days, 27 min): the current time and uptime, that is the time elapsed since the last reboot. It may be useful for example in case of short unavailability of the server. You
connect to the server, run top, look up uptime, and at once it becomes clear how long it is since the last reboot.
the number of users (6 users): This indicator measures the number of users in the system who are currently logged in and running a session.
load average (32.70, 22.49, 14.87): this is the first place to pay attention to. Here we see three numbers, and they represent the average load during the last minute, the last 5 minutes and the last 15 minutes. The average load is determined as the number of processes in the run queue (process code should be executed as soon as possible on the processor core). These figures are important because they reflect the load on the server, and if this number exceeds the number of physical processor cores, it is a very big cause for concern: there is not enough CPU ,and some processes may idle expecting it, which, in turn, increases the overall latency.
The second line, starting with Tasks shows the summary information about processes, processes grouped by type and a count for each group.
total means the total number of processes in the system including the user processes, kernel threads, background processes, and all other possible processes.
running: this is another place to pay attention. This reflects the number of processes running or ready to run (these processes are in the TASK_RUNNING state), and the processes that are in a special mode
(TASK_UNINTERRUPTIBLE state) and wait for a response from the input-output devices, such as the hard drive or another storage device. This value is similar to the load average and indicates the current system load. If the number of processes is larger than the number of physical cores, it is bad.
sleeping: the amount of suspended processes (TASK_INTERRUPTIBLE state) which expect an event to happen (in background), such as receiving a signal or an interrupt. This counter includes all
processes at idle.
stopped: a list of processes which are temporary stopped manually by special signals SIGSTOP, SIGSTP, SIGTTIN, SIGTTOU. Usually this is done in order to trace processes. There is no negative impact of these processes (except if you stopped critical profuction process).
zombie: a list of so-called zombie processes (EXIT_ZOMBIE state), processes that have completed their execution, but for some reason, the parent process hasn’t been notified about this and did not release that these process have already completed their work. If the parent process exits, the orphaned child process becomes a child of the init process, which needs subsequently to properly release it. In a normal situation, there should be no zombie processes, and their existence indicates low quality of the program code.
The third line starting with Cpu(s) lists the CPU utilization percentage.
us (user time): runtime of user processes and programs. The value close to 100% indicates that all cores busy and the CPU almost completely recycled.
sy (system time): runtime of kernel threads in a normal situation, must not exceed 5-10%. A high value indicates that a lot of time is spent on the inner workings of the kernel while the kernel must serve
the user processes.
ni (nice time): runtime of user process with modified scheduling priority (nice).
id (idle time): time spent at idle processes.
wa (io wait time): time which CPU spent waiting for completion of IO operations. Under normal circumstances, this should be close to zero. Values greater than 10 indicate that there are problems with the completion speed of the IO operations (e.g. overloaded disk, a large number of IOPS, filled requests queue).
hi (hardware interrupts): time spent in servicing hardware interrupts, in a normal situation should tend to zero. If this counter is constantly greater than zero, this indicates potential problems in the hardware.
si (software interrupts): time spent in servicing software interrupts. It should also tend to zero, but with increased load (increased number of concurrently running processes) it will also increase. However, values greater than 10-15% indicate a problem with the code of the running programs.
st (stolen time): used only in the virtualization environments and means the time stolen from this virtual machine by the hypervisor in favor of another virtual machine. Constant value greater than zero indicates that hypervisor doesn’t have enough resources to meet the needs of all virtual machines.
The fourth Mem: and fifth Swap: lines present information about the usage of RAM and swap areas. The values shown here are measured in bytes with a given multiplier (not pages).
total: the total amount of memory or swap space.
used: the total amount of memory or swap space used by the program and caches at different levels.
free: the total amount of free memory and swap space.
buffers: memory allocated for buffers, in-memory objects that are associated with a certain set of areas on the block device.
cached: the amount of memory used for caching pages.
A few words about it all to sum up. Linux tries to use all available memory (total = used + free); frequently used memory pages at a given time are moved into the cache layers, which is reflected by the
increase in the cached value. If there is insufficient memory available, the pages will be reclaimed from there. If the system has a swap area, the cache of the pages that are used very rarely, is placed in this area. However, the transfer operation in the swap area are written to disk so you should avoid situations of active use of swap space. If you notice that the value used for swap exceeds 10-50% of the total swap, this is a sign that you do not have enough memory. The next steps are to determine the activity of reading/writing to the swap area, search for processes whose pages are larger than others in the swap area.
We now have a general idea of the total information that is presented in the upper part of the top. Displaying this information can be switched on and off with hotkeys. Try keys l, t, m, 1 (one).
Now consider the lower part of the top.

Here you see a list of processes and detailed information about them. The main tool here is sorting by specific fields. For example, one of the most common uses is to search for the process that uses most CPU or memory. You can sort processes using different fields.
To perform the sort, first press Shift + F in main window and you will get to the field management screen. Then use the arrows to select the desired field and press the space to activate this field in the output of top. When you turn on a field, it will be marked by a star before its name. To set the sorting by a field, you need to select the field and press ‘s’. Then press ‘q’ to return to the main window.

Now, using the knowledge of the summary information, you can search top by sorting for processes
that cause the excessive use of resources (CPU, memory, disk, etc.), Processes that belong to certain users or have certain characteristics.
Finally, I want to give a little advice. Use top as often as you can, pay attention to details, try different sortings, look and remember the values in different states of the system, at high and at low loads. Then you can navigate swiftly through this conglomeration of numbers and information.
Thanks and stay tuned.