

Deep dive into postgres stats: pg_stat_replication
Everything you always wanted to know about Postgres stats
Everyone who works with postgres, knows about postgres’ streaming replication. Every modern database has replication features and postgres is not an exception. Streaming replication is simple, easy to use, mature and reliable. With replication your database becomes distributed so if something goes wrong, troubleshooting becomes a bit harder. I have been working with streaming replication for a long time and there is the one useful feature that helped me understand what’s going on with replication – it’s pg_stat_replication view and today I am going to review it in detail.
First, a few words about how streaming replication works. It’s quite simple really, standby server initiates network connection to the master server and sends its current Write-Ahead Log (WAL) position to the master. Master receives the position and if it has WAL from the received position, it starts sending WAL to the standby server through the initiated connection.
Both servers have separate processes responsible for the established replication connection – WAL sender on master and WAL receiver on standby. For observing replication process there are two postgres stats’ views – pg_stat_wal_receiver and pg_stat_replication. The first view is about WAL receivers on standby – this stats view was introduced only in 9.6 and so I still need to study it in detail, pg_stat_replication is therefore more familiar for me.
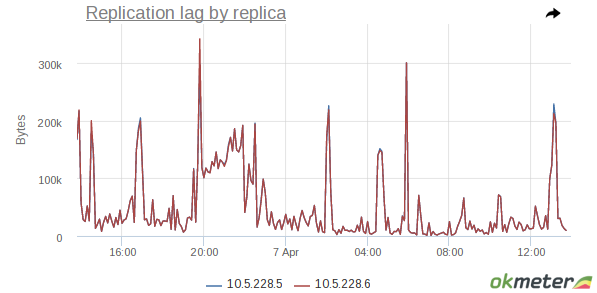
As official documentation says, pg_stat_replication describes currently running WAL senders processes, one process per row. The main help from this view is the replication lag monitoring. I’ll expand on this a bit more.
Replication lag is a very unpleasant situation that might, in the worst case, break replication. From user’s perspective it looks like data retrieved by queries are different in master vs. standbys. This is because replica doesn’t have sufficient time to apply changes coming from the master causing a delay in it’s updates. Moreover, the more changes have been generated the larger is the replication lag. Streaming replication is based on continuous replaying of WAL, where the majority of the changes have been written and distributed to standby instances. Each record in write-ahead log has special identification pointers – hexadecimal log sequence number (LSN). Using these pointers we can address to the exact position inside WAL. Standby during receiving and replaying WAL sends some statistics to the master and pg_stat_replication is just based on these stats.
Regarding pg_stat_replication, besides the obvious information about clients it also holds information on WAL processes that are on standbys. These are LSN locations values – sent_location, write_location, flush_location and replay_location. These show exact LSN locations of the processed WAL. Records that have been sent from the master, first received and written on remote standby, then flushed to a persistent storage and then finally replayed. LSN is designed in such way that it can be represented in bytes, so to calculate the difference between the two LSN’s we can get an amount of WAL in bytes. This is the main way to calculate replication lag in bytes.
Additional functions for working with WAL are helpers. There are two functions that we should know: the first is pg_current_xlog_location() that returns position of the most recent record written in WAL; the second is the pg_xlog_location_diff() that gets two hexadecimal LSNs, calculates the difference and returns decimal value. By using pg_stat_replication and those two functions it’s possible to estimate detailed lag and understand where the bottleneck is:
- difference between current and sent locations shows how many WAL have been generated, but haven’t yet been sent to the standbys;
- difference between sent and written locations shows WAL in the network, that have been sent but not yet written;
- difference between write and flush locations shows WAL written but not flushed to the permanent storage – in case postgres crashes these changes will be lost, because they have not been flushed yet;
- difference between flush and replay locations shows WAL that has been flushed to the permanent storage but not yet replayed – when WAL will be replayed, changes from the master would reach the standby in full;
- difference between current location on master and replay location on standby shows a total lag.
Thus, by using this view and functions we can calculate lag using the following query:
SELECT

client_addr AS client, usename AS user, application_name AS name,

state, sync_state AS mode,

(pg_xlog_location_diff(pg_current_xlog_location(),sent_location) / 1024)::bigint as pending,

(pg_xlog_location_diff(sent_location,write_location) / 1024)::bigint as write,

(pg_xlog_location_diff(write_location,flush_location) / 1024)::bigint as flush,

(pg_xlog_location_diff(flush_location,replay_location) / 1024)::bigint as replay,

(pg_xlog_location_diff(pg_current_xlog_location(),replay_location))::bigint / 1024 as total_lag

FROM pg_stat_replication;
 сlient  |  user   |    name     |   state   | mode  | pending | write | flush | replay | total_lag

---------+---------+-------------+-----------+-------+---------+-------+-------+--------+-----------

10.6.6.9 | replica | walreceiver | streaming | async |       0 |     0 |     0 | 410480 |    410480

10.6.6.7 | replica | walreceiver | streaming | async |       0 |  2845 | 95628 | 112552 |    211025

10.6.6.6 | replica | walreceiver | streaming | async |       0 |     0 |     0 |    128 |       128

10.6.6.8 | replica | walreceiver | streaming | async |  847582 |     0 |     0 |   3056 |    850638
In the example above, we have four asynchronous standbys connected under replica user. Let’s take a closer look at the lag columns:
- First replica has only the replay lag. There are several issues that might cause this:
- The most common case is the overutilized storage, when disks can’t process and apply the all changes within the incoming WAL, check the storage with iostat utility.
- A stuck recovery process on standby due to the long running query – you can check this with standby’ pg_stat_activity.
- 100% of CPU usage by recovery process – this kind of issue is hard to investigate and very often it is related to the current workload. A good example to this is a frequent creation and deletion of tables with large shared_buffers. For digging 100% of the CPU cases I recommend using perf and pg_xlogdump utilities.
- Second replica is related to writing and applying logs. In this case it is most likely that there are problems with storage performance where WAL are stored – you can check the storage utilization with iostat again.
- Third standby is within the norm and there is no significant lag.
- Fourth standby has a pending lag, when the majority of the WAL hasn’t already been sent. This might be due to the low throughput of network between the master and the standby or due to the standby being offline over a long period of time prior to its start. You can use nicstat utility for checking the network.
As you can see, pg_stat_replication is very useful for checking replication lag. If you are using streaming replication it’s a good idea adding these metrics to your monitoring.

In case of cascaded streaming replication, pg_current_xlog_location() wouldn’t work on standbys, in this case use pg_last_xlog_receive_location() – its function is similar and shows the newest WAL received from the upstream server.
Finally, I would like to emphasise that in the upcoming postgres 10.0 ‘xlog’ in functions’ and utilities’ names will be replaced with ‘wal’ e.g. pg_current_xlog_location() will be renamed to pg_current_wal_location(). Due to these changes some monitoring tools and scripts might no longer function and you will need to make appropriate name adjustments for them to work. Also some lag fields, such as write_lag, flush_lag, replay_lag will be built-in in pg_stat_replication view.